Flu Activity Map
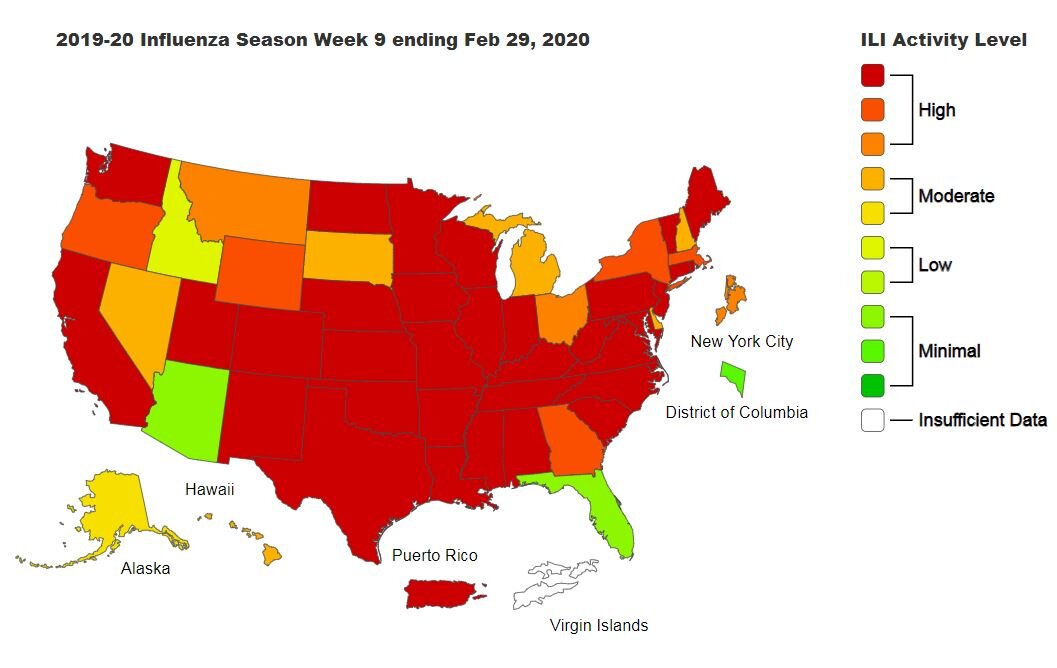
Activity by State as of March 1, 2020
March 1, 2020: Flu intensity is dropping throughout the US. CDC this week reported that the number of states with high levels of activity has dropped from 45 to 42. Georgia is reporting less intense activity, and Florida is reporting minimal activity. Georgia and the Southeast led the way with early flu activity starting in November. We are finally coming out of this difficult season. Look for activity in Georgia to drop to the minimal range in the next 2-3 weeks.
Click here to get more detailed information from CDC.
How is this curve constructed? Each week a group of “sentinel providers” around the country reports to CDC on how many of their patients in emergency departments and clinics have illnesses that match the CDC case definition for “influenza-like illness”, or ILI. ILI is defined as fever PLUS either cough or sore throat that cannot be attributed to another cause such as Strep throat (i.e. Strep throat is NOT an ILI). This data is collected at CDC and posted.
What does the curve mean? The ILI curve does not tell us the total number of people with flu, it tells us what proportion of patients around the country have an illness like the flu. ILI occurs at a low background rate of 1-2% throughout the year, even when flu is not circulating. This background rate of ILI is due to other viruses such as Rhinovirus (cold virus), RSV, and Parainfluenza. Years of experience has shown that when the ILI curve rises above its baseline and peaks 4-8 weeks later, it closely correlates with actual influenza activity as determined by more tedious and expensive viral cultures. Thus, the ILI curve provides a convenient way to track the progress of our yearly influenza season, which almost always arrives between December and March. During the winter (i.e., flu season), most people with ILI actually do have the flu. During the summer and autumn months, patients with ILI almost invariably are infected with other respiratory viruses. The summer of 2009 was a major exception to this rule, reflecting the first wave of pandemic flu due to 2009 H1N1 during the US summer months.
*****************************************************************************
February 22: Flu activity in Week 8 is high in most regions of the country, although some areas of the upper plains States and North West are still in the moderate range. Georgia remains at a high level of Influenza-Like Illness (ILI) activity. We are in the thick of the influenza season, and the ILI graphs both nationally and in Georgia indicate we have experiencing a second peak of flu activity. This second peak is from influenza A, which has largely displaced influenza B.
February 10: Flu activity in Week 5 is high in most regions of the country, although some areas of the upper plains States and North West are still in the moderate range. We are in the thick of the influenza season, and the ILI graphs both nationally and in Georgia indicate we are experiencing a second peak of flu activity. This second peak is from influenza A, which has somewhat displaced influenza B, although flu B still has a substantial presence.
January 25 Flu activity in Week 4 is now high in most regions of the country, although some areas of the upper Mid-West and North West are still in the moderate range. We started in early November with influenza B, but now we are seeing mostly influenza A. This may have the unpleasant effect of prolonging our flu season this year beyond the 6-10 weeks expected for any single region.
December 28 Flu activity nationally is now at its highest level of the season, with most states reporting high levels of infection. However, there are still pockets of low activity in the Northeast, the mid-West, and especially in the North West. These states will likely see increasing levels of flu over the next 2-3 weeks.
December 7 It appears that the Southeast from South Carolina to Texas has been the focus for most of the influenza activity so far, as illustrated by the darkest orange color. Most of the country has not seen significant flu, as depicted by the green areas. Georgia flu activity has picked up considerably in the past four weeks.
November 22 This map posted by the Centers for Disease Control and Prevention (CDC) on November 22, 2019 shows Flu Activity Estimates nationwide during the week ending November 16. There is generally a one-week lag between data collection and release to the public. Due to the Thanksgiving holidays, the next CDC update will be available December 2.
Flu activity continues to increase nationally. It appears that the Southeast from South Carolina to Texas has been the focus for most of the activity so far. Georgia flu activity has picked up considerably in the past two weeks. And Augusta is now seeing more than sporadic cases. Flu season has arrived in Augusta.
November 9, 2019 Flu activity is starting to increase nationally, although we are still outside the “flu season” in most of the country. Louisiana is the only state reporting high levels of flu activity. A band of Southern states from Texas to Georgia are now reporting moderate activity, although Augusta is still seeing only sporadic cases. Flu season is beginning.